Exploring Antarctic Interactions Using GloBI's Interaction Browser

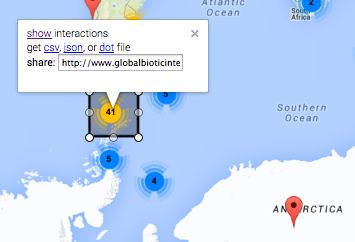
Area selection tool in the GloBI's Interaction Browser provides access to raw data files in addition to a share link. The "show" link updates the visualizations in other parts of the page.
Rugged scientists frequently brave the elements to study who eats what in those frigid yet productive waters of the Southern Ocean. Earlier this year, Ben Raymond was kind enough to share the Southern Ocean diet database that he developed with colleagues (Raymond et al. 2011) with GloBI. Having great data is one thing but . . . being able to (easily) explore the data is a challenge by itself. Enter Göran Bodenschatz, an enthusiastic, passionate web developer. Göran unleashed his skills to create a first pass at the GloBI's Interaction Browser using d3, a javascript visualization library, in combination with the GloBI API. His html/ javascript source code is available here.
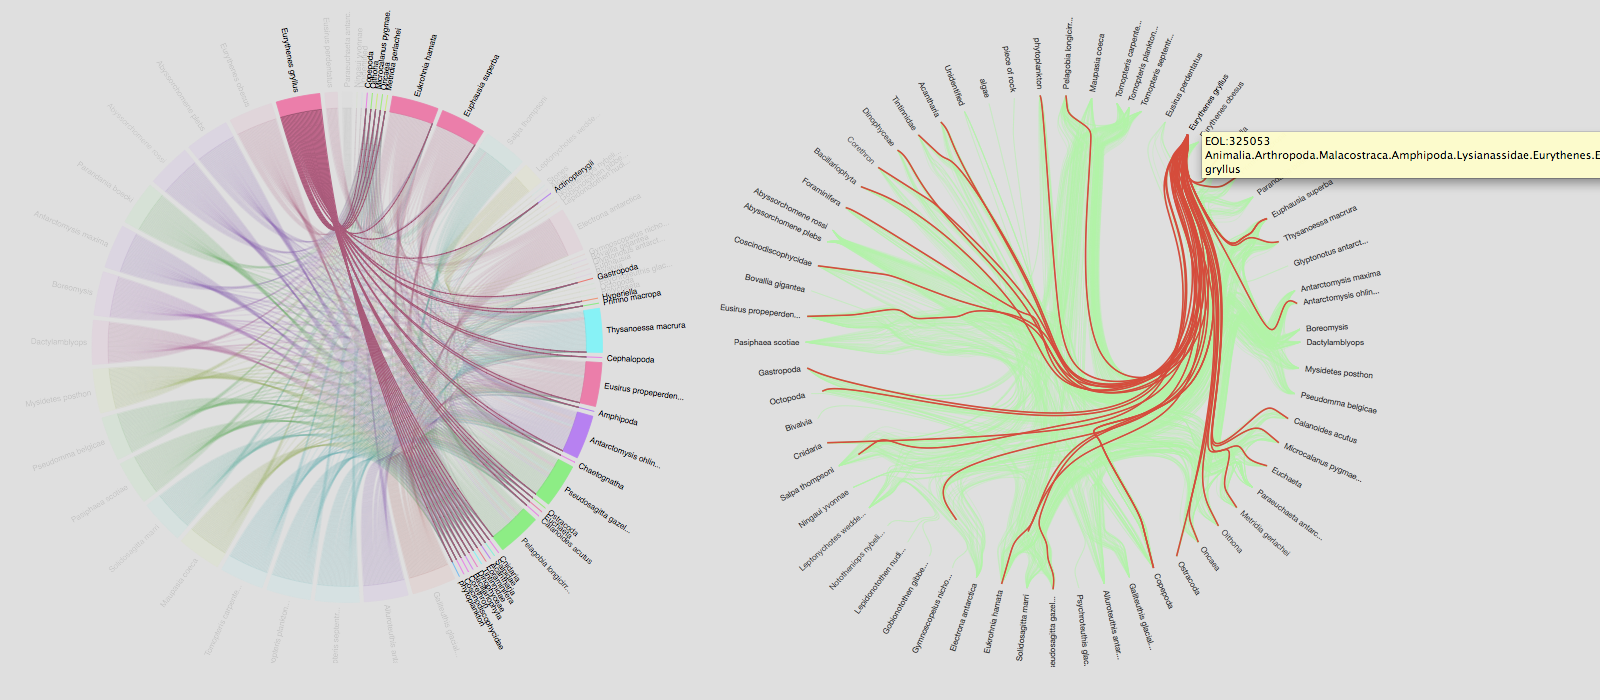
With Ben's data and Göran's tool, we can now "dial-up food webs" (phrase coined by Peter Roopnarine) all across the Antarctic and discover that many species feast on Eurythenes gryllus and its cousin Eurythenes obesus. Not only are the interactions visualized on-the-fly using a dependency wheels, you can also access the raw csv, json or dot files to do offline analysis. In addition, you can share the selected area with others using a provided Interaction Browser "share" link.
This particular experience tells me that simply collecting and aggregating data is not enough. Only after locating and illuminating data with search and visualization tools, I can start to analyze and perhaps understand the biological mechanisms behind the data hidden inside GloBI. . .

Screenshots of circular diagrams that highlight predatory interactions for Eurythenes gryllus around the Antarctic peninsula. The left diagram indicates the number of interactions by the width of the arc on the outside of the circle. The right diagram bundles the interactions to help detect highly interacting taxa. In the right diagram red indicates incoming interactions of selected taxon (e.g. prey), whereas green indicates outgoing interactions (e.g. predator).


